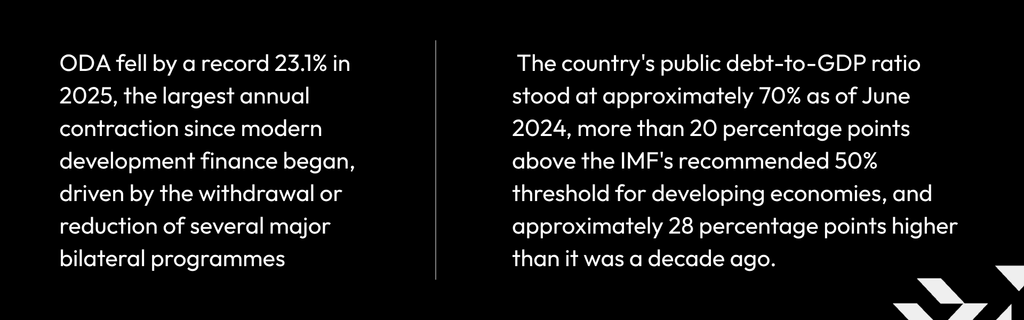
Development finance is under mounting pressure across the Global South. For decades, governments in lower- and middle-income countries have relied on a combination of domestic taxation, bilateral aid, and multilateral development funding to close the gap between public revenues and development needs. Each of those pillars is weakening simultaneously. Global ODA fell by a record 23.1% in 2025, the largest annual contraction since modern development finance began, driven by the withdrawal or reduction of several major bilateral programmes.1 Sub-Saharan Africa’s share of total ODA has declined from 29% in 2021 to 24% in 2023, and projections point to a further 16 to 28% decline in DAC donor flows to the region between 2024 and 2025.2 Domestic tax revenues, meanwhile, remain constrained across much of the continent by informality, narrow corporate bases, and fiscal deficits that have deepened since the COVID-19 shock.
One of the countries living this reality is Kenya. The country’s public debt-to-GDP ratio stood at approximately 70% as of June 2024, more than 20 percentage points above the IMF’s recommended 50% threshold for developing economies, and approximately 28 percentage points higher than it was a decade ago.3 The World Bank has noted that debt servicing now consumes more than a third of government revenue, directly crowding out spending on education, healthcare, and infrastructure.4 The structural question this creates is whether there is an underutilised source of development finance already present in the economy: one that does not depend on donor goodwill, and scales automatically as the private sector grows.
In this context, India legislated the Corporate Social Responsibility Law in 2013, marking a watershed moment in the development finance space. It legislated mandatory corporate social investment, tied directly to profitability and enforceable by law. A decade on, the results are documented, the architecture is understood, and the lessons, both positive and cautionary, are available for other economies to adapt. This article asks what Kenya’s numbers would look like under a comparable framework, and what India’s experience suggests about how to design it well.
THE MODEL
How India Mobilised a Billion-Dollar CSR System
India enacted Section 135 of the Companies Act in 2013, bringing it into force in April 2014.
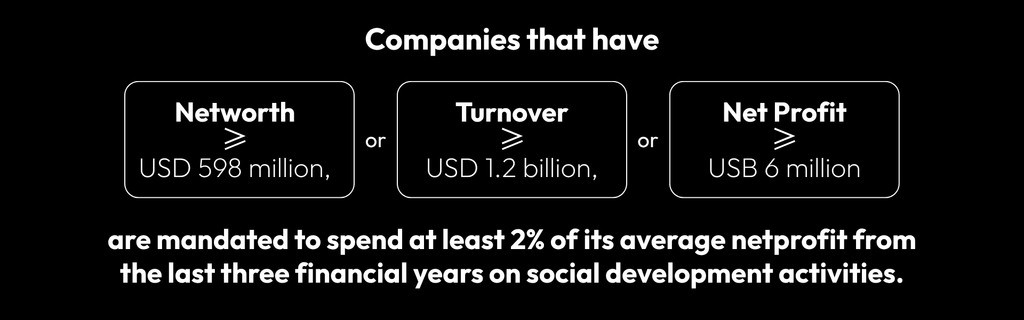
The law requires any company crossing a defined threshold of net worth (INR 500 crore or above, approximately USD 598 million), turnover (INR 1,000 crore or above, approximately USD 1.2 billion), or net profit (INR 5 crore or above, approximately USD 6 million) to spend at least 2% of its average net profit from the preceding three financial years on prescribed social development activities.5 Eligible activities span 12 broad categories defined in Schedule VII of the Act, including education, healthcare, environmental sustainability, rural development, and disaster relief. Implementation can happen directly, through registered foundations, or via government-administered funds.
(Source: India Data Insights, Sattva Consulting)
The scale of what this mandate mobilised is significant. Total CSR expenditure across all eligible companies in India reached INR 34,908.75* crore in FY2023-24, equivalent to approximately USD 4,172 million at 2024 average exchange rates.6 Of that total, NSE-listed companies contributed nearly USD 2,147 million, representing 51.47% of the national CSR pool.7
Beyond the aggregate, India’s CSR data documents what the mandate is financing. Education has consistently absorbed the largest share: in FY2023-24 it accounted for approximately 35% of total CSR expenditure nationally, with healthcare receiving approximately 20%. Together, the two sectors attracted more than half of all mandated corporate social investment.8 Research by India Data Insights, a Sattva Consulting initiative that analyses Ministry of Corporate Affairs (MCA) data annually, documents a structural shift in how companies deploy CSR budgets: from one-off donations and event-based giving toward multi-year programmes, partnerships with established nonprofits, and initiatives designed to generate measurable outcomes.9
What makes India’s experience particularly instructive for the Global South is not just its scale, but its texture. Any country grappling with structural deficits in education and healthcare now has access to a decade of real-world data on what domestically-financed, corporate-led social investment actually looks like in practice: where the money flows, what it funds, and critically, where it falls short. On compliance, the record in India is strong: 98% of NSE-listed companies obligated to spend on CSR in FY2023-24 met or exceeded their mandated contribution.7 On geographic reach, the picture is more instructive than flattering. A disproportionate share of CSR funds has flowed to states where large corporate headquarters are concentrated, particularly Maharashtra, Gujarat, and Tamil Nadu, rather than to regions with the deepest development need.9 Sattva’s decade-long analysis finds that India’s backward and aspirational districts received only 2.5% of cumulative CSR funds between 2014 and 2023.9 That gap between compliance and genuine impact is the most important lesson India offers. It is also a correctable one. A country designing a mandatory CSR framework today, with India’s experience as a reference point, can build geographic prioritisation, impact measurement requirements, and oversight mechanisms from the start, rather than retrofitting them after a decade of concentrated spending.
THE CONTEXT
Why Kenya Needs a New Stream of Development Finance
The case for mobilising domestic corporate resources in Kenya is grounded in a specific and documented set of development gaps that public budgets have not been able to close. Kenya’s GDP grew by 43.5% between 2014 and 2022. Over the same period, child multidimensional poverty rose from 45% to 55.3%, with 12.2 million children today lacking adequate access to education, healthcare, clean water, sanitation, or nutrition.12 Economic growth and human development have not, in Kenya’s recent experience, been moving in the same direction.
In education, 79% of children at late primary age are not proficient in reading, after adjusting for out-of-school rates, according to the World Bank’s Learning Poverty Brief for Kenya published in April 2024. That figure is 18 percentage points worse than the average for lower-middle-income countries globally.13 Government spending on education stood at approximately 3.96% of GDP in 2023, below the global average of 4.40% and well below the levels that development economists associate with meaningful learning improvement at scale.14 In healthcare, only 26% of Kenyans had health insurance coverage as of 2022, with rural coverage as low as 19% in some counties, and out-of-pocket cash payment remaining the primary means of meeting health expenditure for most households.15
Kenya is ranked 152nd out of 191 countries on the Human Development Index.12 These numbers seem to reflect a structural gap between what public finance can deliver and what development requires. While existing financing mechanisms will need to be strengthened to fully close this gap, a mandatory CSR framework can help: as a proportionate, self-scaling stream that draws on corporate profitability to fund social infrastructure, and as a vehicle for testing and de-risking the solutions that go into it before they’re scaled through public delivery systems.
THE DATA
What the Nairobi Securities Exchange Tells Us
This analysis draws on audited financial statements for 68 companies listed on the Nairobi Securities Exchange (NSE),10 representing the full universe for which profit and loss data was systematically reviewed through the Capital Markets Authority of Kenya (CMA). Of the 68, 46 were profitable in their most recent reporting period and constitute the eligible base for this exercise. The remaining 22 were excluded: 12 were loss-making and 10 presented data consistency issues or were non-operating entities such as ETFs and REITs with no underlying Kenya operating profit.
The aggregate Profit After Tax (PAT) figure of USD 3.273 billion is drawn from the most recent available audited results per company, using company-level standalone financial statements throughout. It should be noted that the 68 companies do not share a uniform financial year-end, with reporting periods spanning September 2022 through mid-2025 across multiple distinct year-ends (detailed in Appendix B). The PAT figure is therefore a cross-sectional sum rather than a synchronised fiscal year total. For legislative implementation purposes, a rolling three-year average net profit, consistent with India’s approach,5 would be the appropriate basis for calculating the mandate, smoothing for inter-year variability.
Applied to that base, a 2% mandate generates USD 65.47 million annually from listed companies alone, representing a verified floor of what a mandatory framework would mobilise.
THE EXTRAPOLATION
From the NSE to the National Economy
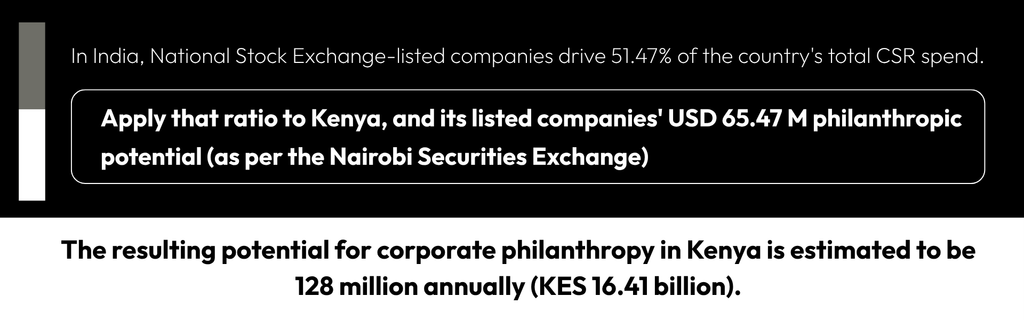
Listed companies are a visible but partial slice of corporate Kenya. Large private conglomerates, mid-sized manufacturers, and high-revenue unlisted firms generate substantial profits that do not appear in NSE filings. To estimate the full national CSR potential, this analysis applies India’s verified ratio: NSE-listed companies contributed 51.47% of India’s total mandated CSR expenditure in FY2023-24.6,7 Applying that same proportion to Kenya’s listed-company figure, the NSE result of USD 65.47 million represents 51.47% of the estimated national total.
The resulting national estimate is USD 127.19 million annually (KES 16.41 billion). That figure carries an important caveat, stated plainly: this is a modelling estimate which rests on the assumption that the ratio of listed-to-total corporate profitability in Kenya is broadly comparable to India’s.
Kenya and India are structurally different markets. India’s NSE listed over 2,000 companies on its main board as of March 2024.7 Kenya’s NSE lists 68 companies in total. The depth and share of total corporate profit captured by listed companies in the two markets may therefore differ materially. Kenya’s unlisted private sector is sizeable but poorly documented at a national level. The 51.47% ratio is applied as a conservative and transparent planning input: if listed companies represent a smaller share of national corporate profit in Kenya than they do in India, the national total would be correspondingly larger, not smaller. The direction of the uncertainty favours a higher figure.
Kenya’s corporate profitability landscape beyond the NSE is inadequately documented: 68 listed companies, inconsistent reporting periods, and gaps in available data collectively constrain the precision of any national estimate. A mandatory CSR framework with centralised disclosure obligations would, as a structural by-product, begin to generate the very corporate profitability intelligence that Kenya currently lacks and that any future policy iteration would benefit from.
CAVEAT
It is important to evaluate what a figure like USD 127.19 million can realistically deliver against the scale of the gaps this article has described. Set against a debt-servicing bill that consumes over a third of government revenue, or an education spending shortfall measured in the billions, a mandatory CSR framework is not a substitute for functioning tax collection, sustainable debt management, or restored donor commitments. India’s experience asserts this too.
What a mandatory CSR framework is well suited to do is fund experimentation. Corporate CSR budgets, unlike public budgets, can absorb the risk of piloting an unproven service-delivery model, testing a new approach to last-mile health access, or backing a cost-effective intervention that has not yet been validated at scale; the kind of trial-and-error that government budgets, bound by procurement cycles and political risk aversion, are rarely able to fund. Paired with the operational expertise, technology, and delivery capacity many corporates already possess, it can help design and stress-test solutions before they are handed to government to absorb and scale, or transferred into county- or national-level public service delivery.
Read this way, a mandatory CSR provision is a catalytic layer of finance that can help Kenya do more and do it better with the resources it already has.
IN CLOSING
An Anchor for Emerging Economies to Learn From
India’s mandatory CSR framework has become one of the more instructive policy experiments available to developing and emerging market economies. A decade of published expenditure data, independently analysed implementation evidence from organisations such as Sattva Consulting, and a regulatory architecture that has been tested, amended, and refined across multiple business cycles, together make it something rare in development policy: a model with genuine feedback built in. For middle-income economies navigating similar development trajectories, that accumulated experience is an asset to be adapted, not a precedent to be replicated wholesale.
The parallels between India’s developmental context in 2013 and Kenya’s today are substantive. Both economies were generating significant corporate profits while large shares of the population remained without reliable access to education and healthcare. Both faced structural constraints on public finance that limited the government’s ability to close those gaps through expenditure alone. India’s response was to legislate a proportionate claim on corporate profitability and direct it toward the communities in which that profitability was being generated. The data in this article suggests that Kenya’s corporate sector is of sufficient scale for a comparable approach to generate material and annually recurring development finance: USD 65.47 million from listed companies alone, and an estimated USD 127.19 million when the broader economy is taken into account.
Kenya does not currently have a mandatory CSR provision equivalent to India’s Section 135: existing provisions under the Companies Act, Cap. 486 are voluntary or narrowly sector-specific.11 The development financing environment that once provided a degree of external cushion, through ODA flows, large bilateral programmes, and concessional finance, is contracting at a pace that makes domestic capital mobilisation increasingly urgent. ODA to sub-Saharan Africa fell 23% in 2025 alone.1 This makes for a strong case for activating domestic corporate resources as a structured, self-scaling, and measurable stream of development, in an increasingly uncertain world.
| KEY FIGURES AT A GLANCE USD 65.47M | Annual CSR yield from Kenya’s 46 profitable NSE-listed companies (2% of USD 3.273B aggregate PAT). USD 127.19M | Estimated national total. Derived by applying India’s verified listed-company CSR ratio of 51.47% to Kenya’s NSE figure. Modelling estimate; acknowledged assumptions apply. |
Appendix A: Exchange Rate Assumptions
All currency conversions use 2024 annual average rates, applied consistently across all figures in this analysis.
| Currency Pair | Rate (2024 Annual Avg.) | Applied To |
| KES / USD | 129 | All Kenya USD conversions |
| KES / ZAR | 7.1 | South Africa comparisons |
| KES / RWF | 0.083 | Rwanda comparisons (BK Group) |
| INR / USD | 83.67 | India CSR USD conversion |
Appendix B: Financial Year-End Variation in NSE Sample
The 68 NSE companies in this dataset report across multiple financial year-ends. All figures used are the most recent available audited results per company, using company-level standalone financial statements throughout.
| Financial Year-End | Included in Sample |
| FYE 28 February 2025 | Yes |
| FYE 30 June 2024 | Yes |
| FYE 30 June 2025 | Yes |
| FYE 30 September 2025 | Yes |
| FYE 31 December 2024 | Yes |
| FYE 31 December 2025 | Yes |
| FYE 31 July 2025 | Yes |
| FYE 31 March 2024 | Yes |
| FYE 31 March 2025 | Yes |
Appendix C: Summary of Key Metrics
| Metric | USD | KES Equivalent |
| Total PAT: 46 Profitable NSE Companies | $3.273 billion | KES 422.26 B |
| 2% Mandate on NSE-Listed Companies | $65.47 million | KES 8.45 B |
| CSR by NSE-Listed Companies in India (FY2023-24) | $2,147 million | — |
| Total CSR Spend in India (FY2023-24) | $4,172 million | — |
| NSE-Listed Companies’ Share of India CSR Pool | 51.47% | — |
| Total Kenya CSR Potential (national estimate) | $127.19 million | KES 16.41 B* |
Appendix D: India CSR Benchmark Data (FY2023-24)
| India CSR Data Point | INR (crore) / % | USD / Note |
| CSR Spend: NSE-Listed Companies | 17,967 crore | ~USD 2,147 million |
| Total CSR Spend: All Eligible Companies | 34,908.75 crore* | ~USD 4,172 million |
| Ratio applied for Kenya extrapolation | 51.47% | Conservative planning benchmark |
| Compliance rate: eligible NSE companies | 98% | 1,367 of 1,394 obligated companies |
| Education share of total CSR spend | ~35% | Largest single sector nationally |
| Healthcare share of total CSR spend | ~20% | Second largest sector nationally |
Sources: PrimeInfobase / PRIME Database Group (NSE-listed spend, April 2025); MCA Parliamentary Reply, Rajya Sabha (*Note: based on provisional date on total spend, February 2026; latest CSR data is now available on the government’s CSR portal); MCA data via CAalley / Economic Times (sector shares). INR figures converted at INR/USD = 83.67 (2024 annual average). The 51.47% ratio is derived and applied as a conservative planning benchmark only.
Appendix E: Endnotes and Sources
1. OECD. (2026). Preliminary ODA Data 2025. Development Co-operation Directorate, April 2026. Total DAC ODA fell 23.1% in 2025, the largest annual contraction on record. ODA to sub-Saharan Africa fell 23.0% to USD 29.2 billion. Available at: one.oecd.org/document/DCD(2026)8/en/pdf
2. OECD. (2025). Reducing Poverty and Inequalities Through ODA. Data Explainer, November 2025. Sub-Saharan Africa’s share of total ODA declined from 29% in 2021 to 24% in 2023. Available at: oecd.org/en/data/insights/data-explainers/2025/11/reducing-poverty-and-inequalities-through-official-development-assistance-oda.html
3. Cytonn Investments. (2024). Review of Kenya’s Public Debt 2024. Nairobi: Cytonn. Kenya’s debt-to-GDP ratio reached 70.0% as of June 2024, approximately 20 percentage points above the IMF threshold of 50% for developing countries. Available at: cytonn.com/topicals/review-of-kenyas. See also: Central Bank of Kenya. (2024). cbk.go.ke
4. World Bank. (2024). Kenya Public Finance Review. Washington DC: World Bank. Debt servicing consumes more than a third of government revenue. Available at: allafrica.com/stories/202601060328.html
5. Government of India. Companies Act, 2013, Section 135 and Schedule VII. Ministry of Corporate Affairs. Eligibility thresholds: net worth INR 500 crore or above; turnover INR 1,000 crore or above; net profit INR 5 crore or above. Spend obligation: 2% of average net profit over preceding three financial years. Available at: mca.gov.in
6. Ministry of Corporate Affairs, Government of India. (February 2026). Parliamentary Reply, Rajya Sabha. Annual CSR expenditure FY2019-20 to FY2023-24: total spend in FY2023-24 was INR 34,908.75 crore (~USD 4,172 million at INR/USD = 83.67). Available at: indiacsr.in/csr-spend-jumps-from-rs-10065-cr-to-rs-34908-cr-2024
7. PrimeInfobase / PRIME Database Group. (April 2025). CSR Spend by NSE-Listed Companies Jumps 16% to INR 18,000 Crore in FY2023-24. NSE-listed companies: INR 17,967 crore (~USD 2,147 million). 1,394 companies obligated; 1,367 (98%) met or exceeded mandate. Available at: primedatabasegroup.com
8. Ministry of Corporate Affairs, Government of India. MCA CSR data, FY2023-24, as reported in: CAalley.com / Economic Times. (2024). Education accounted for approximately 35% of total CSR expenditure; healthcare approximately 20%. Available at: caalley.com/news-updates/indian-news/csr-spend-trebles-in-a-decade-education-health-get-lions-share
9. India Data Insights, a Sattva Consulting Initiative. (2024). The State of CSR in India (2014-2023): Data Guide 2024. Bengaluru: Sattva. Key findings: CSR funds concentrated in Maharashtra, Gujarat, Tamil Nadu; aspirational districts received only 2.5% of cumulative CSR funds 2014-2023. Available at: indiadatainsights.com/product/the-state-of-csr-in-india-2014-23-data-guide-2024
10. Nairobi Securities Exchange. (2025). Listed Companies. Available at: nse.co.ke/listed-companies
11. Kenya Law. Companies Act, Cap. 486. Nairobi: Kenya Law. Kenya’s current Companies Act does not include a mandatory CSR spending provision equivalent to India’s Section 135. Available at: kenyalaw.org
12. UNICEF Kenya. (2024). UNICEF Kenya Annual Report 2024. Nairobi: UNICEF. Kenya is ranked 152nd out of 191 countries on the HDI. Child multidimensional poverty rose from 45% in 2014 to 55.3% in 2022, affecting 12.2 million children, even as GDP grew 43.5% over the same period. Available at: open.unicef.org/download-pdf?country-name=Kenya&year=2024
13. World Bank. (April 2024). Kenya Learning Poverty Brief. Washington DC: World Bank. 79% of children at late primary age in Kenya are not proficient in reading, adjusted for out-of-school rates. This is 18 percentage points worse than the average for lower-middle-income countries. Available at: documents1.worldbank.org/curated/en/099062624142031212/pdf/P179209-3009ffa4-8e8c-4f7f-ac89-97ddf60aebe9.pdf
14. World Bank / UNESCO Institute for Statistics. (2024). Government expenditure on education, Kenya, 2023: 3.96% of GDP. Global average: 4.40% of GDP. Available at: theglobaleconomy.com/Kenya/Education_spending
15. Kenya National Bureau of Statistics. (2023). Kenya Demographic and Health Survey (KDHS) 2022. Nairobi: KNBS. 26% of Kenyans had health insurance in 2022; urban 40%, rural 19%. Available at: knbs.or.ke